Genomic comparison
Philipp Bayer
4 March 2021
Last updated: 2023-12-01
Checks: 7 0
Knit directory:
Amphibolis_Posidonia_Comparison/
This reproducible R Markdown analysis was created with workflowr (version 1.7.1). The Checks tab describes the reproducibility checks that were applied when the results were created. The Past versions tab lists the development history.
Great! Since the R Markdown file has been committed to the Git repository, you know the exact version of the code that produced these results.
Great job! The global environment was empty. Objects defined in the global environment can affect the analysis in your R Markdown file in unknown ways. For reproduciblity it’s best to always run the code in an empty environment.
The command set.seed(20210414) was run prior to running
the code in the R Markdown file. Setting a seed ensures that any results
that rely on randomness, e.g. subsampling or permutations, are
reproducible.
Great job! Recording the operating system, R version, and package versions is critical for reproducibility.
Nice! There were no cached chunks for this analysis, so you can be confident that you successfully produced the results during this run.
Great job! Using relative paths to the files within your workflowr project makes it easier to run your code on other machines.
Great! You are using Git for version control. Tracking code development and connecting the code version to the results is critical for reproducibility.
The results in this page were generated with repository version 1c8943e. See the Past versions tab to see a history of the changes made to the R Markdown and HTML files.
Note that you need to be careful to ensure that all relevant files for
the analysis have been committed to Git prior to generating the results
(you can use wflow_publish or
wflow_git_commit). workflowr only checks the R Markdown
file, but you know if there are other scripts or data files that it
depends on. Below is the status of the Git repository when the results
were generated:
Ignored files:
    Ignored:    .Rhistory
    Ignored:    .Rproj.user/
    Ignored:    renv/library/
    Ignored:    renv/staging/
Note that any generated files, e.g. HTML, png, CSS, etc., are not included in this status report because it is ok for generated content to have uncommitted changes.
These are the previous versions of the repository in which changes were
made to the R Markdown (analysis/plot.Rmd) and HTML
(docs/plot.html) files. If you’ve configured a remote Git
repository (see ?wflow_git_remote), click on the hyperlinks
in the table below to view the files as they were in that past version.
| File | Version | Author | Date | Message |
|---|---|---|---|---|
| Rmd | 1c8943e | Philipp Bayer | 2023-12-01 | workflowr::wflow_publish(files = "analysis/plot.Rmd") |
| html | 2243fa6 | Philipp Bayer | 2022-02-23 | muh files |
| html | 1a19f93 | Philipp Bayer | 2022-02-23 | Build site. |
| html | 9b59467 | Philipp Bayer | 2022-02-23 | Rewrite Orthofinder analysis |
| html | c0db4a5 | Philipp Bayer | 2021-10-07 | Build site. |
| Rmd | 08b28ea | Philipp Bayer | 2021-10-07 | wflow_publish(files = c("analysis/*")) |
| html | 76c8918 | Philipp Bayer | 2021-04-15 | Build site. |
| Rmd | 49dcbb8 | Philipp Bayer | 2021-04-15 | wflow_publish(files = list.files("analysis/", pattern = "*Rmd", |
| Rmd | 9e449bb | Philipp Bayer | 2021-04-14 | Add missing files |
| html | 9e449bb | Philipp Bayer | 2021-04-14 | Add missing files |
| html | 9e91425 | Philipp Bayer | 2021-04-14 | Build site. |
| Rmd | fa39572 | Philipp Bayer | 2021-04-14 | wflow_publish(c("analysis/plot.Rmd", "analysis/_site.yml", "analysis/index.Rmd"), |
library(tidyverse)── Attaching core tidyverse packages ──────────────────────── tidyverse 2.0.0 ──
✔ dplyr 1.1.2 ✔ readr 2.1.4
✔ forcats 1.0.0 ✔ stringr 1.5.0
✔ ggplot2 3.4.2 ✔ tibble 3.2.1
✔ lubridate 1.9.2 ✔ tidyr 1.3.0
✔ purrr 1.0.1
── Conflicts ────────────────────────────────────────── tidyverse_conflicts() ──
✖ dplyr::filter() masks stats::filter()
✖ dplyr::lag() masks stats::lag()
ℹ Use the conflicted package (<http://conflicted.r-lib.org/>) to force all conflicts to become errorslibrary(cowplot)
Attaching package: 'cowplot'

The following object is masked from 'package:lubridate':

    stamp
theme_set(theme_cowplot())
library(RColorBrewer)
library(wesanderson)
library(patchwork)
Attaching package: 'patchwork'

The following object is masked from 'package:cowplot':

    align_plots
# reps <- data.frame(
# stringsAsFactors = FALSE,
# Class = c("LINEs","LTRs","DNA",
# "Unclassified","Non-repetitive","LINEs","LTRs","DNA","Unclassified",
# "Non-repetitive","LINEs","LTRs","DNA","Unclassified",
# "Non-repetitive","LINEs","LTRs","DNA","Unclassified","Non-repetitive"),
# Assembly = c("A. antarctica","A. antarctica",
# "A. antarctica","A. antarctica","A. antarctica","P. australis",
# "P. australis","P. australis","P. australis","P. australis","Z. marina",
# "Z. marina","Z. marina","Z. marina","Z. marina","Z. muelleri",
# "Z. muelleri","Z. muelleri","Z. muelleri","Z. muelleri"),
# BP = c(805898L,45776664L,37822890L,
# 1546483L,158725395L,38319733L,611240734L,100034681L,
# 37142931L,428369702L,3103364L,123623579L,27390818L,
# 6060480L,96439714L,14331182L,164253396L,142828758L,
# 21922574L,274954485L),
# Percent = c(0.33,18.71,15.46,0.63,
# 64.87131,3.15,50.3,8.23,3.06,35.25364,1.19,47.46,10.52,
# 2.33,37.02,2.32,26.57,23.1,3.55,44.46)
# )
reps <- readxl::read_xlsx('./data/Repeat_coding.xlsx')
reps <- reps %>% dplyr::filter(Class != 'Total')
reps$Class <- factor(reps$Class, levels = c('LINEs', 'LTRs', 'DNA', 'Unclassified', 'Total CDS', 'Non-repetitive'))
reps# A tibble: 24 × 4
Class Assembly BP Percent
<fct> <chr> <dbl> <dbl>
1 LINEs A. antarctica 805898 0.329
2 LTRs A. antarctica 45776664 18.7
3 DNA A. antarctica 37822890 15.5
4 Unclassified A. antarctica 1546483 0.632
5 Total CDS A. antarctica 29544393 12.1
6 Non-repetitive A. antarctica 129181002 52.8
7 LINEs P. australis 38319733 3.15
8 LTRs P. australis 611240734 50.3
9 DNA P. australis 100034681 8.23
10 Unclassified P. australis 37142931 3.06
# ℹ 14 more rowspal <- wes_palette("Zissou1", 6, type = "continuous")
p1 <- reps %>% ggplot(aes(x=Assembly, fill=Class, y = BP/1000000)) +
geom_bar(position='stack', stat='identity') + ylab('Size (Mbp)') +
#scale_fill_brewer(palette='Dark2') +
scale_fill_manual(values=pal) +
theme(axis.text.x = element_text(face="italic"))
p1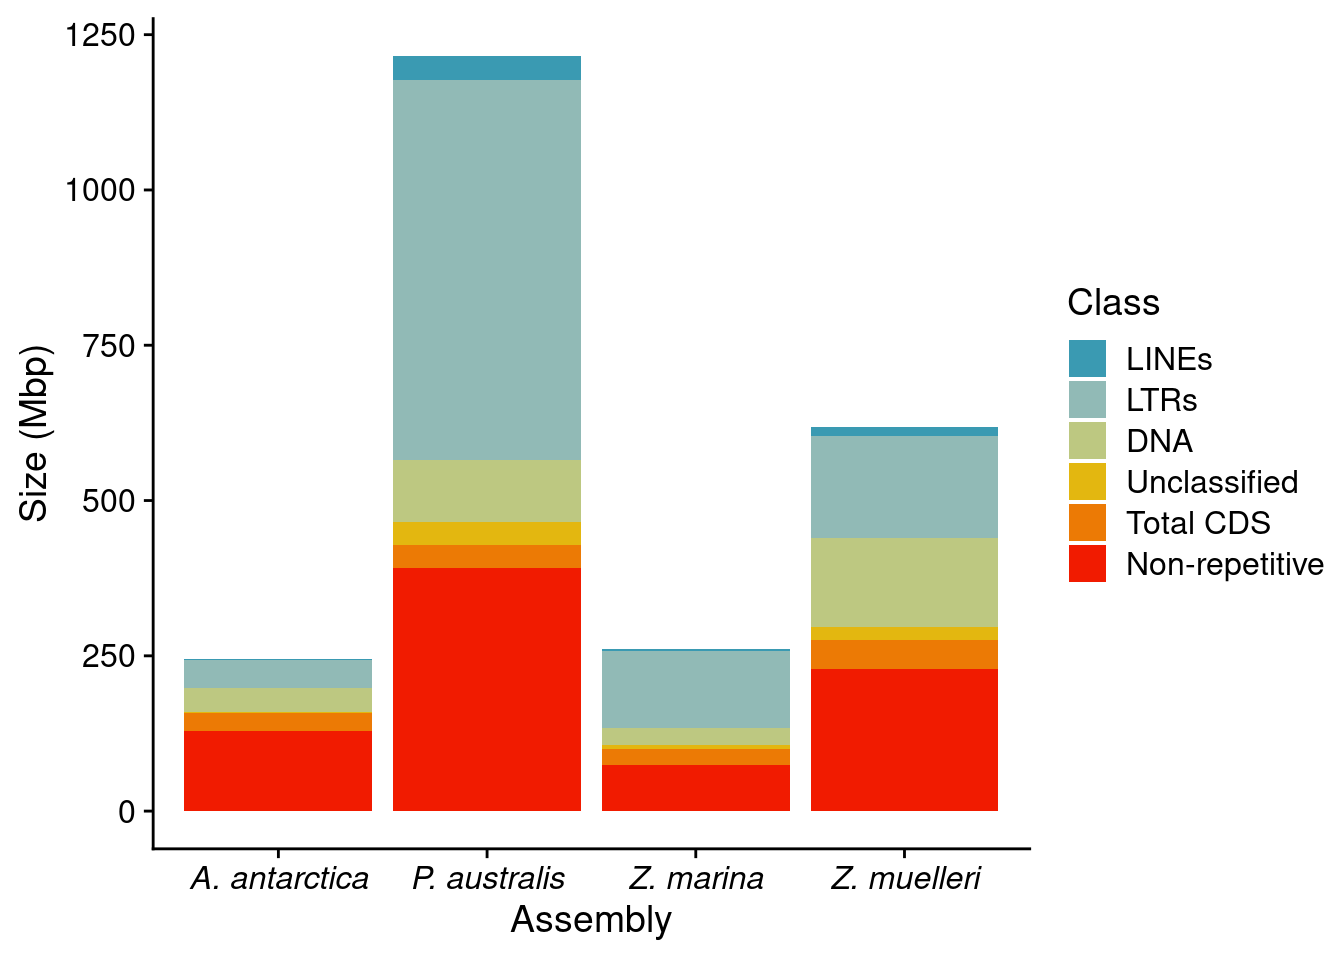
p2 <- reps %>% ggplot(aes(x=Assembly, fill=Class, y = Percent)) + geom_bar(position='stack', stat='identity')+
  #scale_fill_brewer(palette='Dark2') +
    scale_fill_manual(values=pal) +
  theme(axis.text.x =  element_text(face="italic")) +
  ylab('Percent\n of assembly')
p2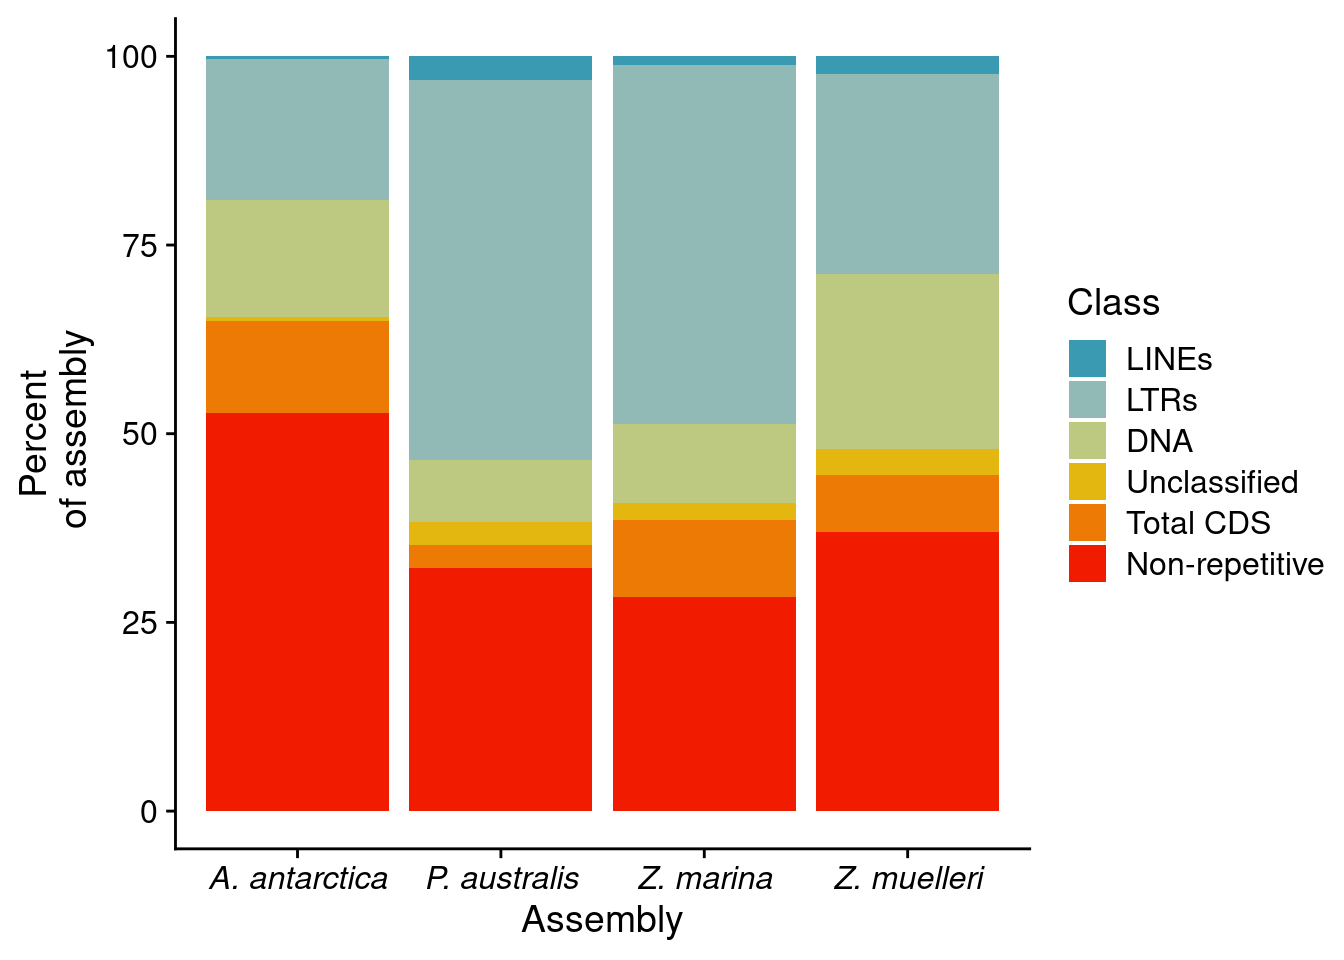
patch <- p1/p2 + plot_annotation(tag_levels = 'A')
patch[[1]] = patch[[1]] + theme(axis.text.x = element_blank(),
                                        axis.ticks.x = element_blank(),
                                        axis.title.x = element_blank() )

patch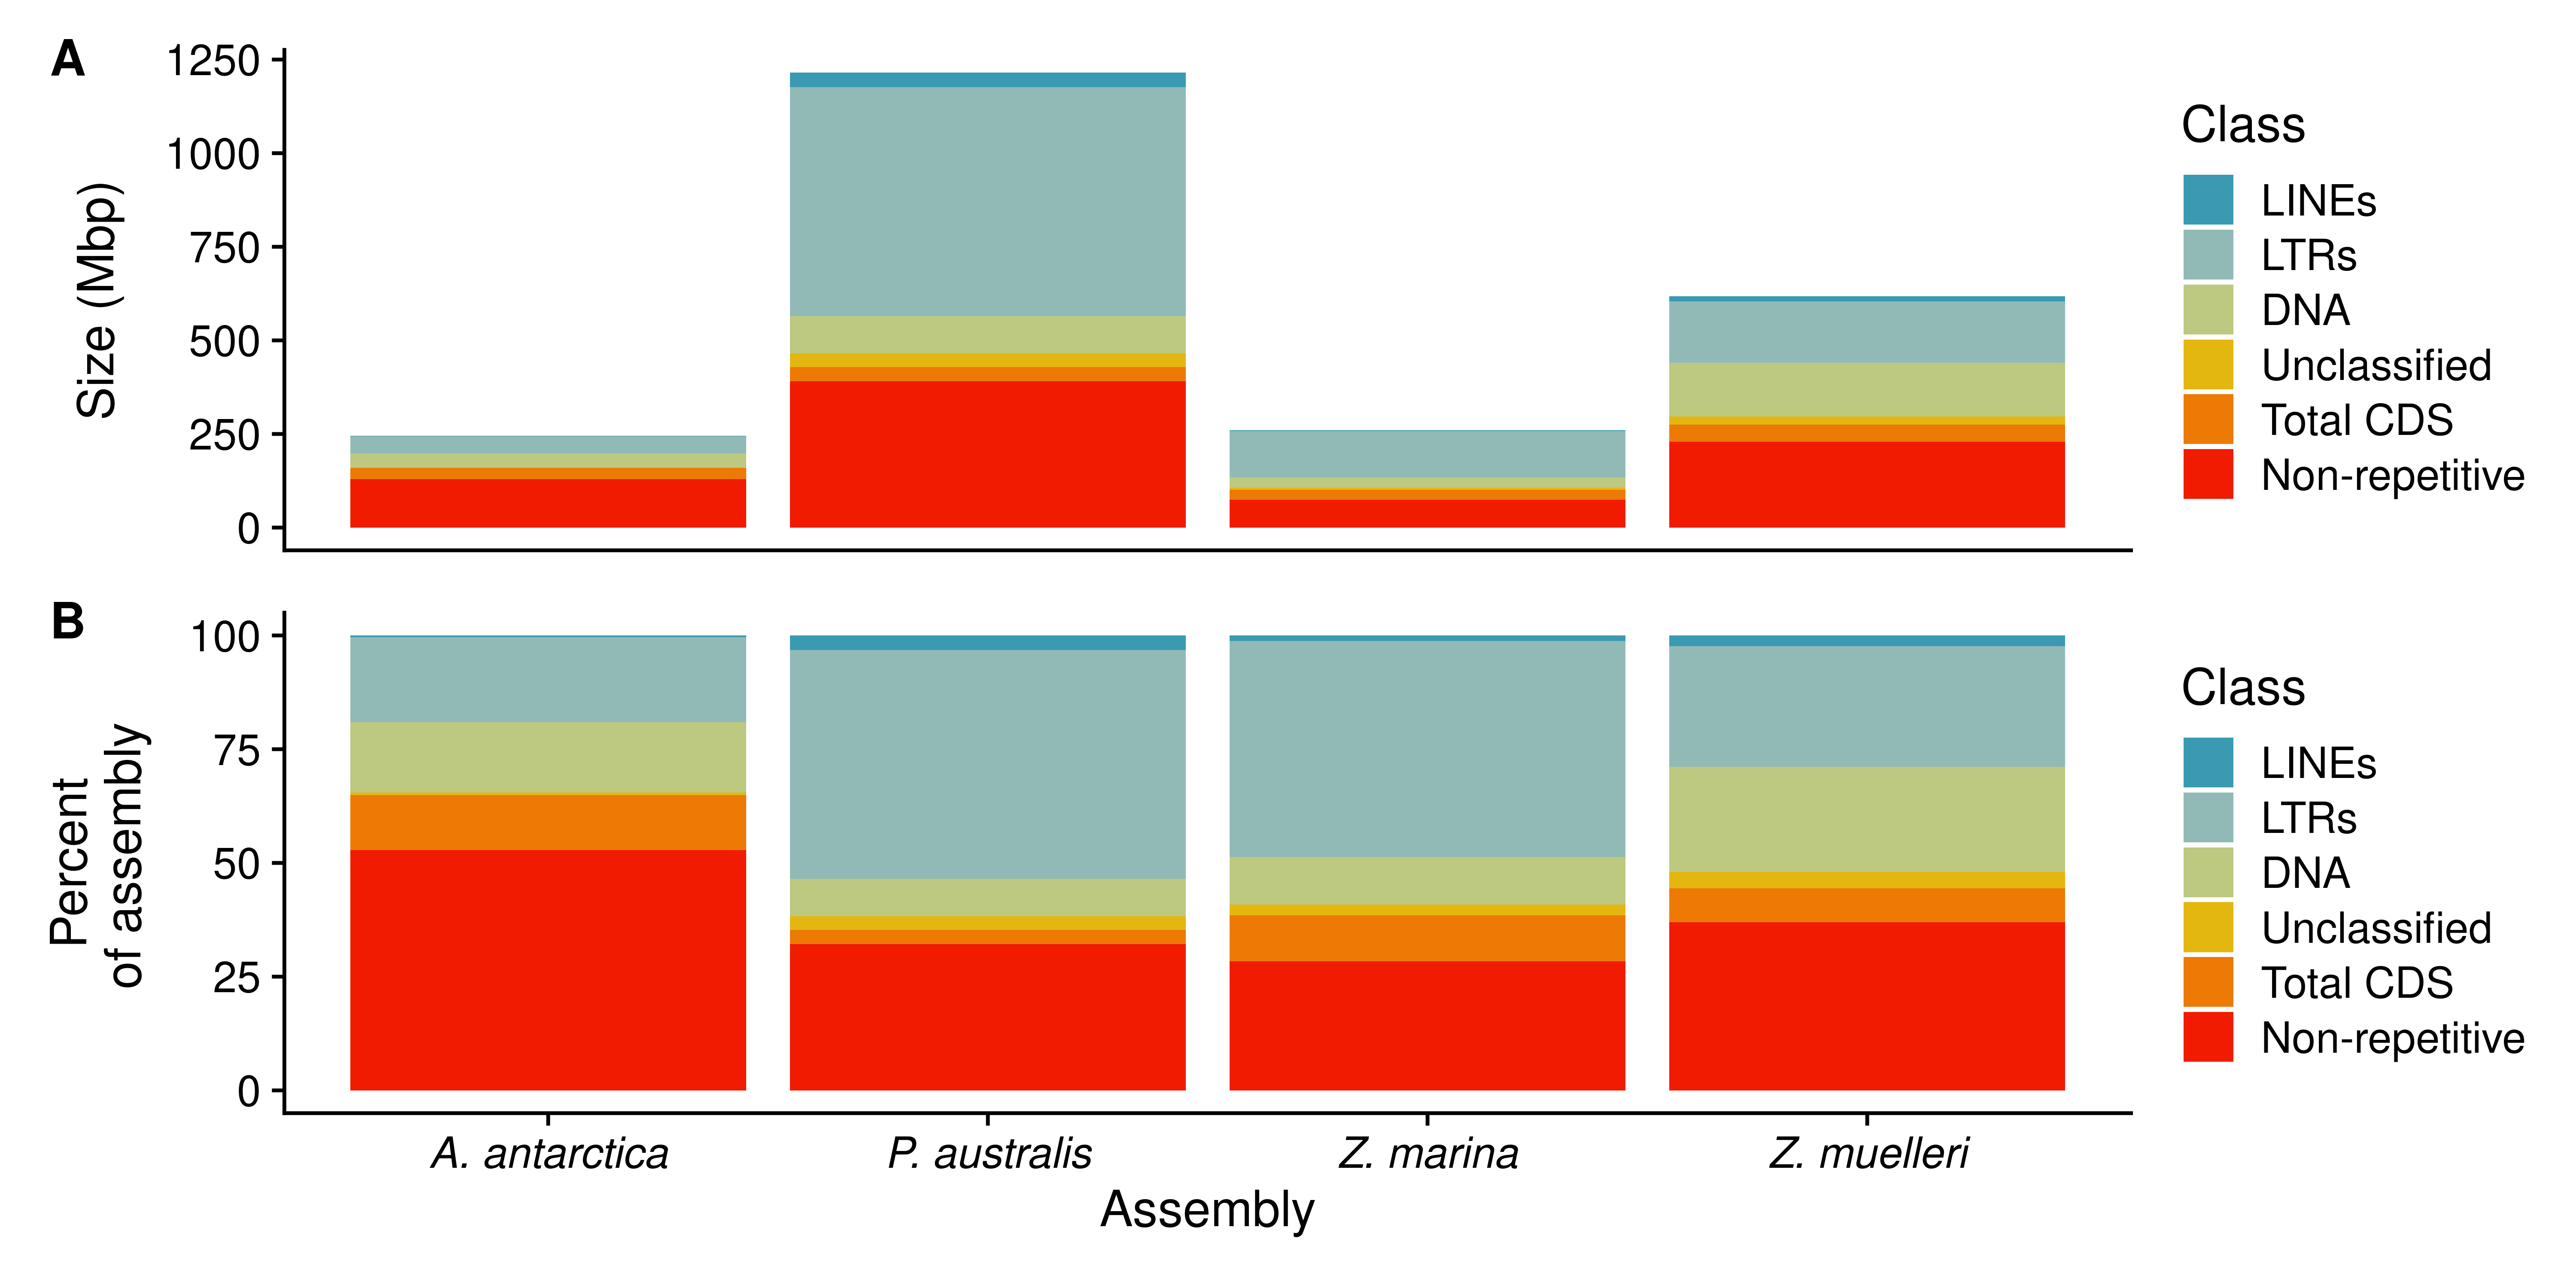
reps %>% filter(Class=='Non-repetitive') %>% ggplot(aes(x=Assembly, fill=Class, y = BP)) + geom_bar(position='stack', stat='identity')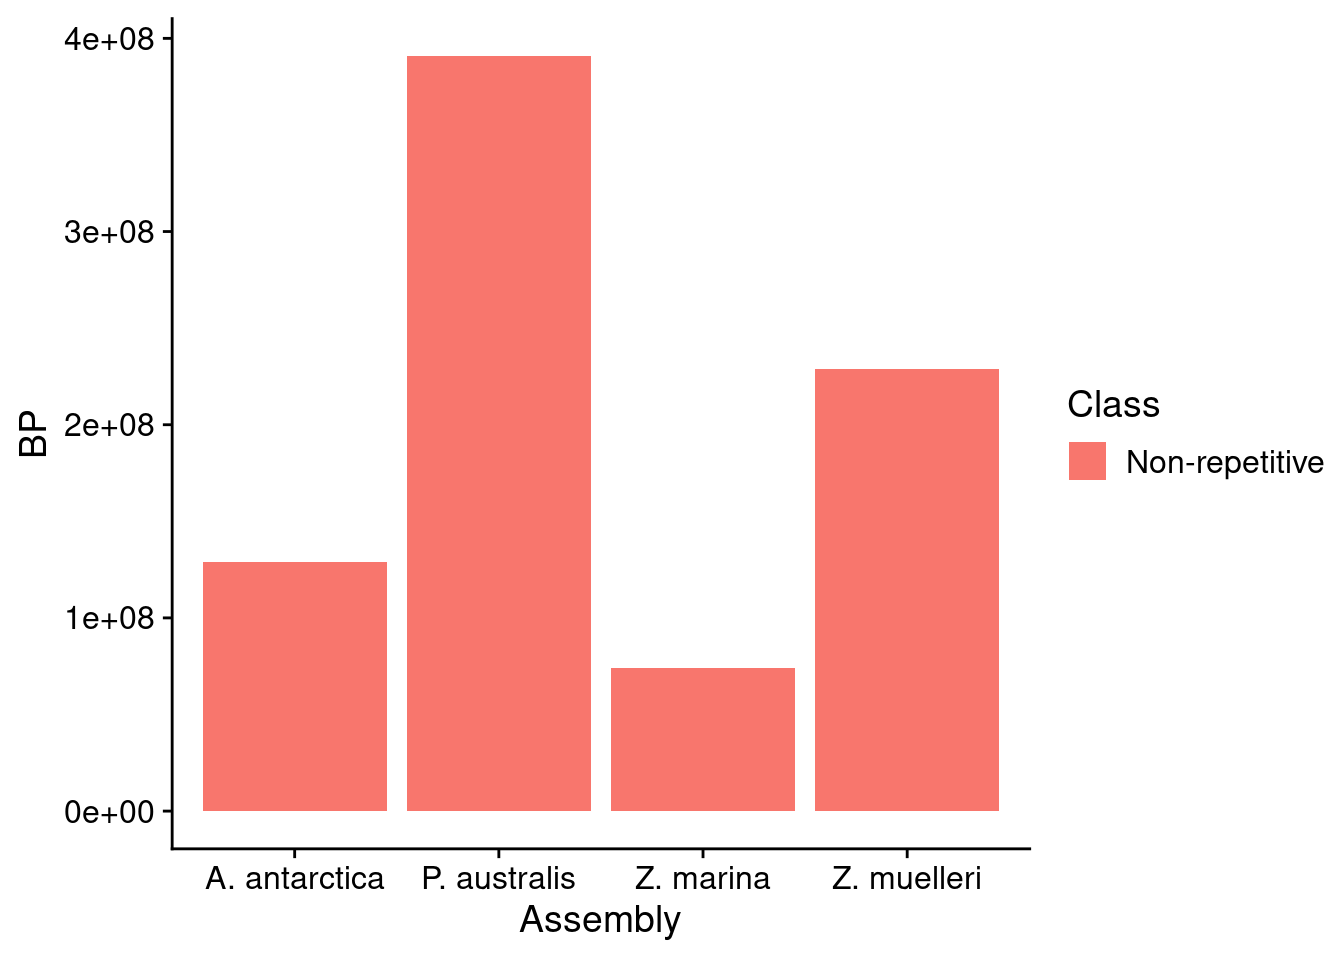
reps |> mutate(newclass = case_when(Class == 'Non-repetitive' | Class == 'Total CDS' ~ 'Non-repetitive',
                                    TRUE ~ 'Repetitive')) |>
  group_by(Assembly,  newclass) |>
  summarise(BP=sum(BP),
            Percent =sum(Percent)) |>
  mutate(Mbp = BP / 1000000)
`summarise()` has grouped output by 'Assembly'. You can override using the
`.groups` argument.# A tibble: 8 × 5
# Groups: Assembly [4]
Assembly newclass BP Percent Mbp
<chr> <chr> <dbl> <dbl> <dbl>
1 A. antarctica Non-repetitive 158725395 64.9 159.
2 A. antarctica Repetitive 85951935 35.1 86.0
3 P. australis Non-repetitive 428369702 35.3 428.
4 P. australis Repetitive 786738079 64.7 787.
5 Z. marina Non-repetitive 100313870 38.5 100.
6 Z. marina Repetitive 160178241 61.5 160.
7 Z. muelleri Non-repetitive 274954485 44.5 275.
8 Z. muelleri Repetitive 343335910 55.5 343.
sessionInfo()R version 4.3.2 (2023-10-31)
Platform: x86_64-pc-linux-gnu (64-bit)
Running under: Ubuntu 20.04.6 LTS
Matrix products: default
BLAS: /usr/lib/x86_64-linux-gnu/blas/libblas.so.3.9.0
LAPACK: /usr/lib/x86_64-linux-gnu/lapack/liblapack.so.3.9.0
locale:
[1] LC_CTYPE=en_AU.UTF-8 LC_NUMERIC=C
[3] LC_TIME=en_AU.UTF-8 LC_COLLATE=en_AU.UTF-8
[5] LC_MONETARY=en_AU.UTF-8 LC_MESSAGES=en_AU.UTF-8
[7] LC_PAPER=en_AU.UTF-8 LC_NAME=C
[9] LC_ADDRESS=C LC_TELEPHONE=C
[11] LC_MEASUREMENT=en_AU.UTF-8 LC_IDENTIFICATION=C
time zone: Australia/Perth
tzcode source: system (glibc)
attached base packages:
[1] stats graphics grDevices datasets utils methods base
other attached packages:
[1] patchwork_1.1.2 wesanderson_0.3.7 RColorBrewer_1.1-3 cowplot_1.1.1
[5] lubridate_1.9.2 forcats_1.0.0 stringr_1.5.0 dplyr_1.1.2
[9] purrr_1.0.1 readr_2.1.4 tidyr_1.3.0 tibble_3.2.1
[13] ggplot2_3.4.2 tidyverse_2.0.0 workflowr_1.7.1
loaded via a namespace (and not attached):
[1] gtable_0.3.3 xfun_0.39 bslib_0.4.2
[4] processx_3.8.1 callr_3.7.3 tzdb_0.4.0
[7] vctrs_0.6.2 tools_4.3.2 ps_1.7.5
[10] generics_0.1.3 fansi_1.0.4 highr_0.10
[13] pkgconfig_2.0.3 readxl_1.4.2 lifecycle_1.0.3
[16] compiler_4.3.2 farver_2.1.1 git2r_0.32.0
[19] munsell_0.5.0 getPass_0.2-2 httpuv_1.6.11
[22] htmltools_0.5.5 sass_0.4.6 yaml_2.3.7
[25] later_1.3.1 pillar_1.9.0 jquerylib_0.1.4
[28] whisker_0.4.1 cachem_1.0.8 tidyselect_1.2.0
[31] digest_0.6.31 stringi_1.7.12 labeling_0.4.2
[34] rprojroot_2.0.3 fastmap_1.1.1 grid_4.3.2
[37] colorspace_2.1-0 cli_3.6.1 magrittr_2.0.3
[40] utf8_1.2.3 withr_2.5.0 scales_1.2.1
[43] promises_1.2.0.1 timechange_0.2.0 rmarkdown_2.21
[46] httr_1.4.6 cellranger_1.1.0 hms_1.1.3
[49] evaluate_0.21 knitr_1.42 rlang_1.1.1
[52] Rcpp_1.0.10 glue_1.6.2 BiocManager_1.30.20
[55] renv_1.0.2 rstudioapi_0.14 jsonlite_1.8.4
[58] R6_2.5.1 fs_1.6.2